Graphing multiple Data Queries on a single Graph
In a previous section we examined how to create a new Custom Data Query to enable us to query the LM-SENSORS-MIB::lmTempSensorsTable for temperature information. We then learned how to create a new Graph Template to display that information as a graph. Finally, in the previous section, we explored how to use a CDEF function to modify data values.
In this section we shall explain how to produce a single graph which displays multiple temperature values for easier comparison and reduced screen-area requirements.
Duplicating a Graph Template
The first step is to create a new Graph Template which will be used when we wish to graph multiple related temperature values.
We could simply create a new Graph Template from scratch, as we did in Graphing a custom Data Query, however a faster method would be to make a copy of the LM-SENSORS-MIB - lmTempSensorsTable template we created earlier and then modify it to suit our needs.
To duplicate a Graph Template first click on Graph Templates on the Cacti main menu. Once the Graph Template List has loaded place a tick in the check-box to the right of the LM-SENSORS-MIB - lmTempSensorsTable template we created earlier, select Duplicate from the Action drop-down list and then click the Go button.
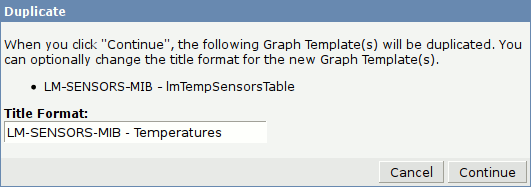
As you can see in Figure 6.1 [Duplicating a Graph Template] you will be prompted for a name for the new Graph Template. Once you have entered a descriptive name click on the Continue button to create the duplicate Graph Template. When the Graph Template List is displayed click on the newly created Graph Template to begin editing it.
Create additional Graph Template Items
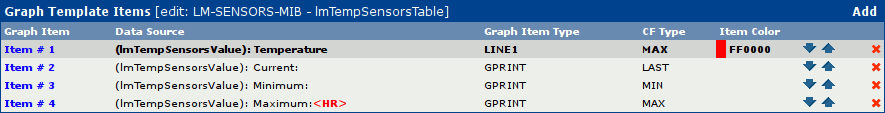
As you can see in Figure 6.2 [The Graph Template Items] the duplicate Graph Template already contains the three Graph Template Items we added when creating the single temperature template in the previous section.
Most of the systems we use are capable of monitoring the temperature in at least three different locations, most commonly the CPU, the Bridge and the RAM modules. For this reason we have decided that our new template should provide Graph Template Items for these three readings. If your hardware supports more or less temperature sensors feel free to add more or less Graph Template Items as appropriate. If, like us, you have a variety of different hardware capable of monitoring the temperature of a range of different components then you may need to create multiple Graph Templates to accommodate all available sensor configurations.
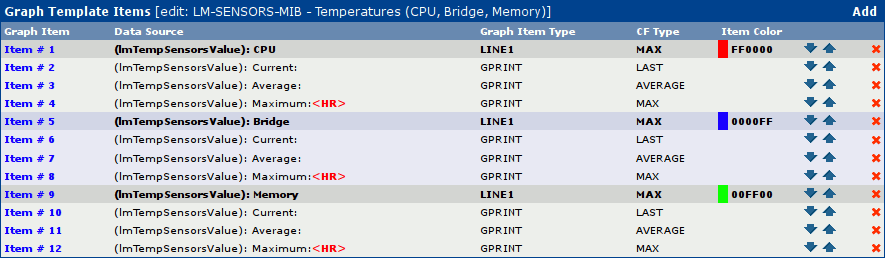
You can see in the above example, Figure 6.3 [Additional Graph Template Items], that we have created two new sets of Graph Template Items, one for the Bridge and one for the Memory modules. We have also renamed the first Graph Template Item to reflect its new role displaying CPU temperature.
Create additional Graph Item Inputs
In the above section we created some additional Graph Template Items to display the output of multiple temperature sensors on a single graph however our Graph Template currently only makes use of a single Graph Item Input. If we were to attempt to instantiate our new Graph Template in its present state we would see three lines as expected but they would all be for the same sensor. Clearly, this is not what we desire, so we need to create two additional Graph Item Inputs and associate them with the correct Graph Template Items.

Directly beneath the section displaying the Graph Template Items defined for the current Graph Template is a section labelled Graph Item Inputs. It probably closely resembles that shown in Figure 6.4 [Graph Item Inputs] above. As you can see in the example we currently have a single Graph Item Input defined. The first step therefore is to click on the existing Graph Item Input and modify it so that it resembles that shown in Figure 6.5 [Creating an additional Graph Item Input] below.
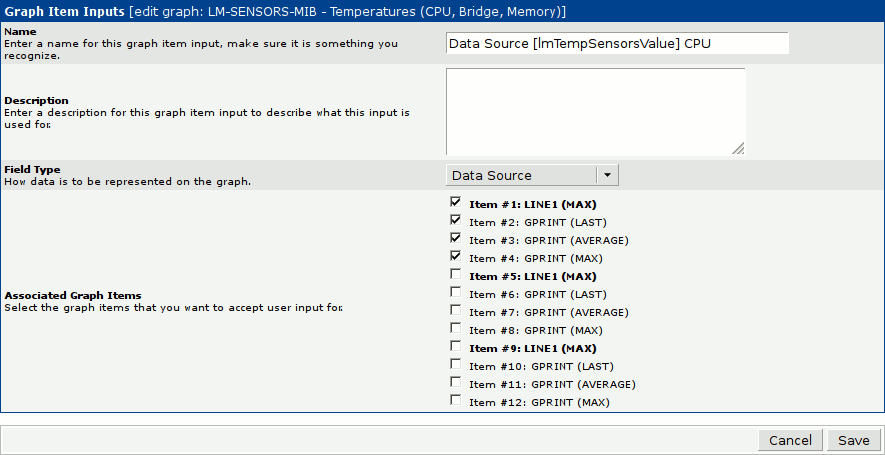
As you can see from the above example we have renamed the existing Graph Input Item to Data Source [lmTempSensorsValue] CPU so that we can easily associate it with the correct Data Source later. We have also un-ticked the check-boxes next to the entries for Graph Template Items 5-12 so that this Graph Item Input will only be used for the Graph Template Items relating to CPU temperature.
Once the existing Graph Item Input has been modified two more need to be created by clicking on the Add link at the top right hand corner of the Graph Item Inputs list. When creating the additional Graph Item Inputs remember to name them something recognisable so that they can be associated with the correct Data Source later and to select the correct Graph Template Items.
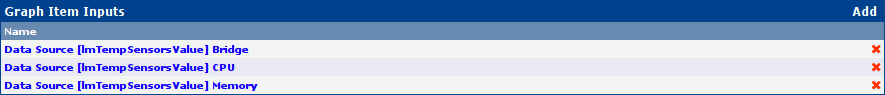
The completed Graph Input Items list should resemble that shown in Figure 6.6 [Completed Graph Item Inputs] above.
Associating the Graph Template with the Data Query
The final remaining step before we can make use of our new Graph Template is to associate the new Graph Template with our Data Query, as we did when we created our first Graph Template in Graphing a custom Data Query.
To make this association we need to first click on Data Queries in the Cacti main menu to display the Data Queries list. Once the Data Queries list has been displayed click on the Data Query we created in the previous step, probably named SNMP - lmTempSensorsTable.
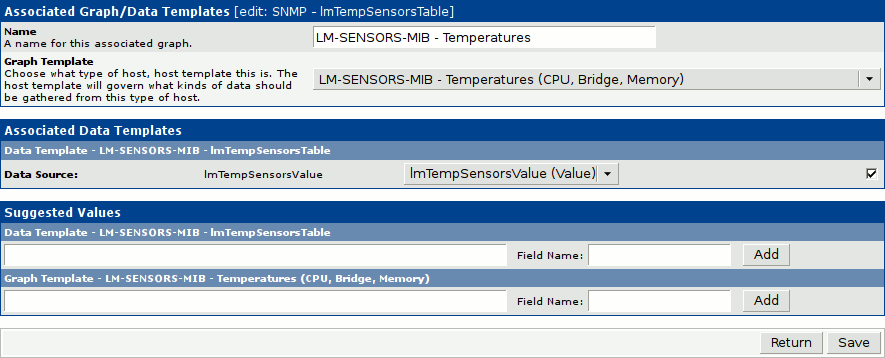
As you can see in Figure 6.7 [Associated Graph Templates] below there is currently only a single Graph Template associated with this Data Query. To create an additional Graph Template association click on the Add link at the top right hand corner of the Associated Graph Templates list.

The example shown below in Figure 6.8 [Associated Graph/Data Templates] should provide all the information required to complete creation of the Graph Template / Data Template association. As you can see we have selected the Graph Template we just created and have entered a recognisable name. We have also ticked the check-box to the right of the Data Source entry in the Associated Data Templates section to indicate that this graph makes use of this Data Source. As all the information required to create a title for the graph is already contained in the Graph Template and the data sources will be pre-existing there is no need to provide any Suggested Values.
When you are satisfied that the Graph Template / Data Template association will be created correctly click on the Save button at the bottom right corner.
Instantiating Graphs
Now that we have created a suitable Graph Template we can use that template to instantiate a real graph. To do so we first need to click on Graph Management on the Cacti main menu. When the Graph Management page has been displayed you should be able to see a section labelled Graph Management as shown in Figure 6.9 [The Graph Management page] below.

To create a new Graph click on the Add link at the top right corner to display the Graph Template Selection page, as shown below in Figure 6.10 [Selecting the new Graph Template].
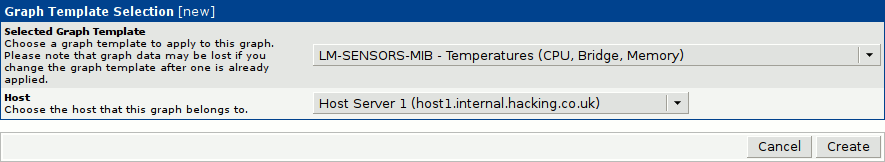
As you can see in the above example there are only two fields to be selected. The first selects the desired Graph Template so we have chosen the Graph Template we just created. The second field specified the Device which the graph should be for. In our example we have selected one of our host servers however you will need to select whichever Device you have been creating temperature graphs for thus far.
Once you are confident that the correct Graph Template and Device have been selected click on the Create button at the lower right corner.
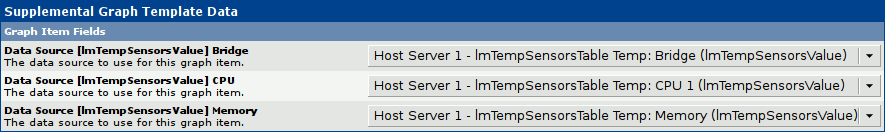
The final step is to select the correct Data Sources from the Supplemental Graph Template Data section. As you can see in Figure 6.11 [Supplemental Graph Template Data] below it is a simple matter of selecting the appropriate Data Source from the list until all Data Sources are correctly mapped.
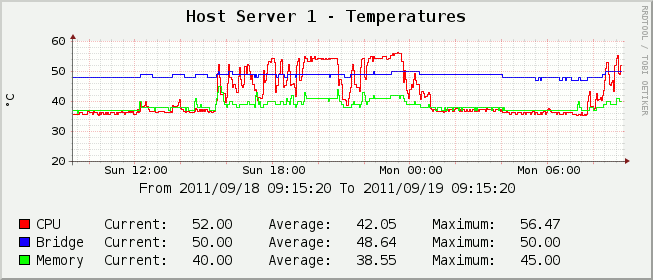
You should now have a Graph displaying the readings from multiple temperature sensors similar to that shown in Figure 6.12 [Example temperature Graph displaying values from multiple sensors] below.