CDEF Functions
What is a CDEF function
In the previous two sections we produced graphs of the output of temperature sensors using a custom Data Query, Data Template and Graph Template. We also learned that, since the output of the temperature sensors is in thousandths of a degree, we needed to apply a mathematical function to divide the values we received by one thousand.
Luckily the RRDtool application provides a feature known as CDEF functions which allow the data extracted from a Round Robin Database to be subjected to a mathematical operation before it is used to plot the graph. The Cacti application provides a graphical interface allowing CDEF functions to be created and edited making using a CDEF function in a Graph Template trivial.
Before we begin creating our own CDEF functions however we first need to introduce a method of writing mathematical expressions known as Reverse Polish Notation (RPN)◳ which is ideally suited to stack based processing. Simply put instead of writing the expression in the normal way the expression is split into its operands and its operator and then reconstituted with the operands first and the operator last. The example below may explain more clearly.
The expression X / 1000 would be written as X, 1000, / in Reverse Polish Notation.
As all of our expressions will be fairly simple we shall not explain RPN further here. More information can be found in the rrdgraph_data◳ section of the official RRDtool Documentation◳.
Creating a new CDEF function
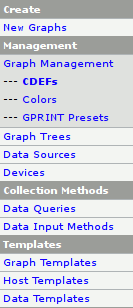
To begin creating our new CDEF function we first need to access the CDEF Function List by clicking on the Graph Management entry on the Cacti main menu and then clicking the CDEFs entry, as shown in Figure 5.1 [Cacti Main Menu] above.
The CDEF Function List provides a list of all the currently defined CDEF Functions which can be used in our Graph Templates. As you can see in the example below, Figure 5.2 [CDEF functions list], we have already created a function called Divide by 1000. Obviously, as we have not yet explained how such a function is created, you probably do not have such a function in your CDEF Function List.
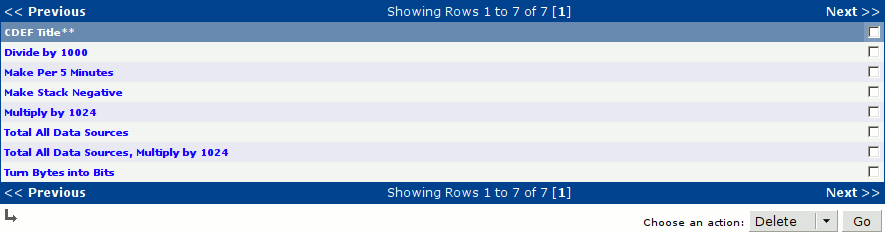
Above the CDEF Function List is a box labelled CDEFs, as shown below in Figure 5.3 [Creating a new CDEF function (Step 1)]. As you can see there is a link labelled Add at the top right corner. Click on the Add link to display the CDEFs [new] page.

As you can see in Figure 5.4 [Creating a new CDEF function (Step 2)] the CDEFs [new] form has a single field which should be filled with a user friendly name for the new CDEF function we are about to create. As our new CDEF function will divide the data value by one thousand a suitable name is probably Divide by 1000.
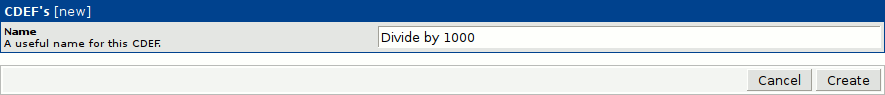
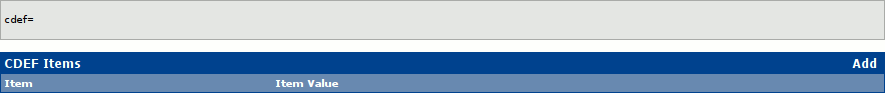
Once you have entered a name for the new CDEF function click on the Create button at the bottom right hand corner. The page should now refresh and a new box labelled CDEF Items will be visible. This section lists the CDEF Items which constitute this CDEF function. As you can see in Figure 5.5 [Adding a new CDEF Item (Step 1)] there are currently no CDEF Items.
As you may have guessed we are now going to add three CDEF Items to our new CDEF function. The first of these items will be a reference to the Data Source on which we wish to perform our calculation. To add a new CDEF Item click on the Add link at the top right hand corner of the CDEF Items List.
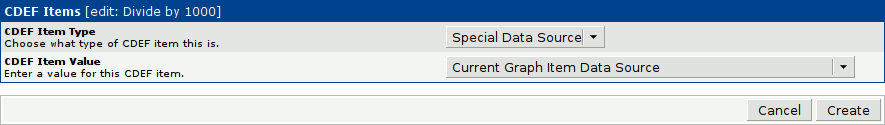
The above example, Figure 5.6 [Adding a new CDEF Item (Step 2)], shows the New CDEF Item page. We have selected Special Data Source as the CDEF Item Type and Current Graph Item Data Source as the CDEF Item Value so that the first parameter to our new CDEF function will be the Data Source we are using on our graph. Once you have selected the correct options click on the Create button to add this CDEF Item to our new CDEF function.
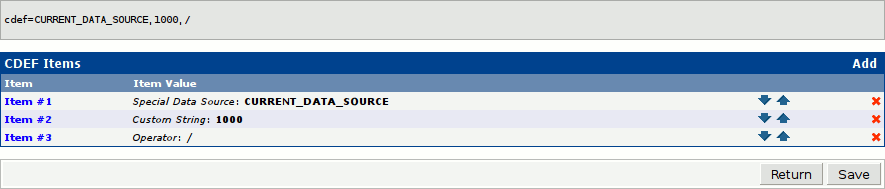
We can now add the remaining CDEF Items to our CDEF Function so that the resulting CDEF Items List resembles that shown below in Figure 5.7 [The completed CDEF function]. As you can see we have added a Custom String with a value of 1000 and an Operator with a value of / to complete our new CDEF function.
When the new CDEF function is complete click on the Save button at the bottom right hand corner.
Applying a CDEF function
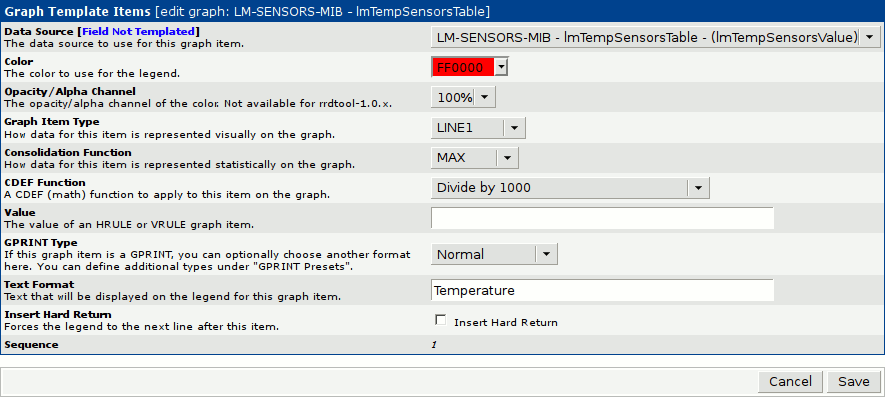
Now that we have created a new CDEF function which divides the data value by one thousand we can modify the Graph Template we created earlier to display the correct temperatures. To begin editing our Graph Template click on Graph Templates on the Cacti main menu and then click on the LM-SENSORS-MIB - lmTempSensorsTable template. You should be able to see the Graph Template Items section at the top of the page, as shown below in Figure 5.8 [The Graph Template Items].
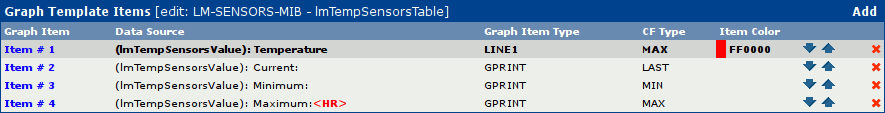
To edit a Graph Template Item click on its label. In the following example we have chosen Item # 1. As you can see in Figure 5.9 [Editing the Graph Template Item] below one of the fields is labelled CDEF function and is currently set to None.
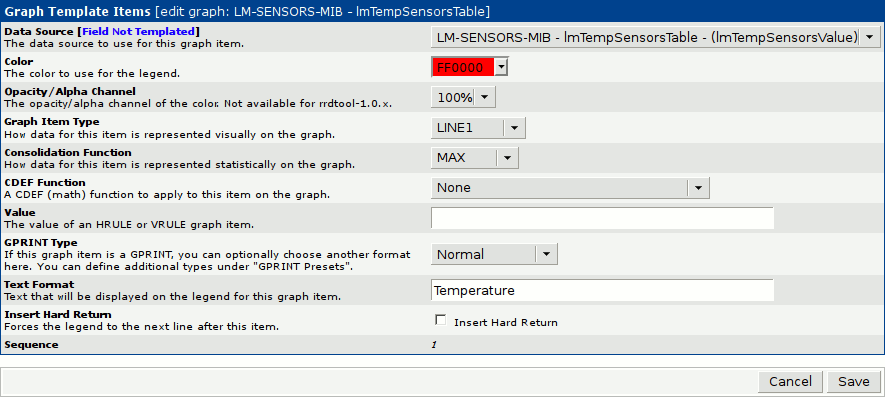
As we wish to use the Divide by 1000 function we have just created select it from the CDEF function drop-down list and click on the save button located at the bottom right hand corner, as shown below in Figure 5.10 [The edited Graph Template Item].
Once you have repeated the process for the remaining Graph Template Items you may return to the Graph View to admire the results.
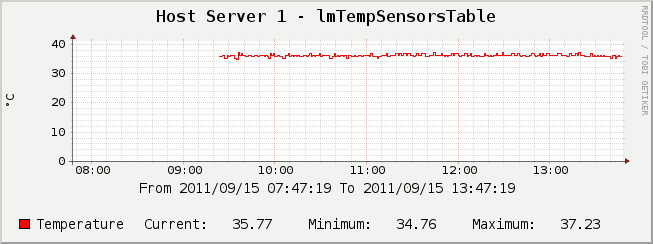
The resulting graph
As you can see in the example below, Figure 5.11 [Example Temperature Graph with CDEF function applied], the graph is now displaying more sensible values, indicating an average CPU temperature of about 36°C.
In the next chapter we shall address the remaining issue with our graphs by combining all the temperature readings onto a single graph for easy comparison and reduced screen area requirements.